Chapter 2 — Project Management and Quality Management
1. Project Management Fundamentals
Likely Exam Question (5 marks)
"Define project management. Explain the characteristics of a project."
Definition
A project is a temporary endeavor undertaken to create a unique product, service, or result with a defined beginning and end.
Project Management is the application of knowledge, skills, tools, and techniques to project activities to meet project requirements.
Characteristics of a Project
| Characteristic | Description |
|---|---|
| Temporary | Definite start and end dates |
| Unique | Creates a one-time deliverable |
| Progressive Elaboration | Details emerge as project proceeds |
| Resource-Constrained | Limited budget, time, people |
| Goal-Oriented | Specific objectives to achieve |
Triple Constraint (Iron Triangle)
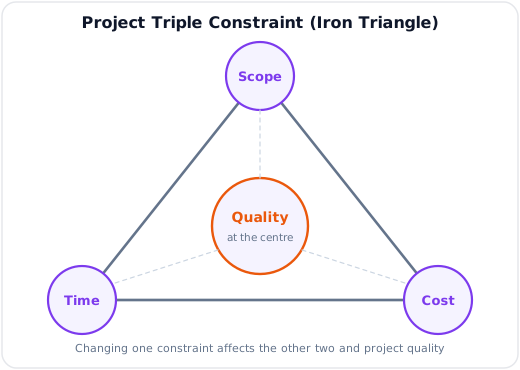
- Changing one constraint affects the others
- Quality sits at the center — affected by all three
2. Project Life Cycle
Likely Exam Question (10 marks)
"Explain the different phases of a project life cycle with suitable diagram."
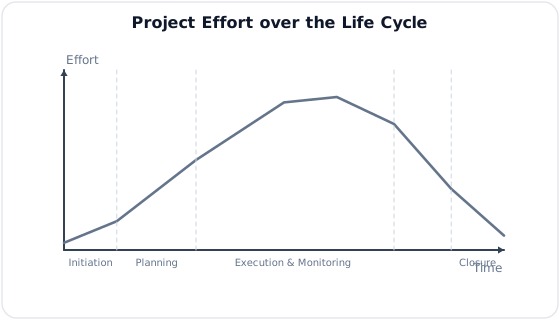
Phases of Project Life Cycle
| Phase | Activities | Key Outputs |
|---|---|---|
| 1. Initiation | Define project, feasibility study, stakeholder identification | Project Charter, Feasibility Report |
| 2. Planning | Scope definition, WBS, scheduling, budgeting, risk planning | Project Plan, WBS, Schedule, Budget |
| 3. Execution | Carry out project plan, team management, quality assurance | Deliverables, Progress Reports |
| 4. Monitoring & Controlling | Track progress, manage changes, corrective actions | Performance Reports, Change Requests |
| 5. Closure | Final deliverable, documentation, lessons learned | Final Report, Handover Document |
Diagram
Key Documents in Each Phase
| Document | Phase | Purpose |
|---|---|---|
| Project Charter | Initiation | Authorizes the project, defines scope |
| Work Breakdown Structure (WBS) | Planning | Hierarchical decomposition of work |
| Gantt Chart | Planning/Execution | Visual timeline of tasks |
| Risk Register | Planning | Identifies and assesses risks |
| Progress Report | Monitoring | Tracks actual vs. planned progress |
| Lessons Learned | Closure | Documents successes and failures |
Key Exam Points — Project Life Cycle
- 5 phases: Initiation → Planning → Execution → Monitoring → Closure
- WBS is a hierarchical breakdown of project scope into manageable work packages
- Project Charter formally authorizes the project
3. CPM — Critical Path Method
Likely Exam Question (10 marks)
"What is CPM? Find the critical path for the following network diagram. Calculate EST, EFT, LST, LFT, and float."
Definition
Critical Path Method (CPM) is a deterministic project scheduling technique that identifies the longest sequence of dependent tasks (critical path) to determine the minimum project duration.
Key Terminology
| Term | Symbol | Formula |
|---|---|---|
| Earliest Start Time | EST | Max(EFT of all predecessors) |
| Earliest Finish Time | EFT | EST + Duration |
| Latest Finish Time | LFT | Min(LST of all successors) |
| Latest Start Time | LST | LFT − Duration |
| Total Float | TF | LST − EST = LFT − EFT |
| Free Float | FF | Min(EST of successors) − EFT |
CPM Calculation Steps
- Draw Network Diagram (Activity-on-Node or Activity-on-Arrow)
- Forward Pass — Calculate EST and EFT (left to right)
- Backward Pass — Calculate LFT and LST (right to left)
- Calculate Float — TF = LST − EST
- Identify Critical Path — Activities with TF = 0
Solved Example
Q. Given the following activities, find the critical path and project duration.
| Activity | Duration (days) | Predecessor |
|---|---|---|
| A | 3 | — |
| B | 4 | — |
| C | 2 | A |
| D | 5 | B |
| E | 3 | A, B |
| F | 4 | C, D, E |
Solution:
Step 1 — Forward Pass:
| Activity | Duration | EST | EFT |
|---|---|---|---|
| A | 3 | 0 | 3 |
| B | 4 | 0 | 4 |
| C | 2 | 3 | 5 |
| D | 5 | 4 | 9 |
| E | 3 | 4 | 7 |
| F | 4 | 9 | 13 |
- EST of E = max(EFT of A, EFT of B) = max(3, 4) = 4
- EST of F = max(EFT of C, EFT of D, EFT of E) = max(5, 9, 7) = 9
Step 2 — Backward Pass:
| Activity | LFT | LST | TF |
|---|---|---|---|
| F | 13 | 9 | 0 |
| E | 9 | 6 | 2 |
| D | 9 | 4 | 0 |
| C | 9 | 7 | 4 |
| B | 4 | 0 | 0 |
| A | 6 | 3 | 3 |
Step 3 — Critical Path:
Activities B, D, and F have Total Float = 0, hence they are critical.
Key Exam Points — CPM
- Critical path = longest path = minimum project duration
- Activities on critical path have zero float
- Delay in any critical activity delays the entire project
4. PERT — Program Evaluation and Review Technique
Likely Exam Question (10 marks)
"Differentiate between CPM and PERT. Calculate expected time and variance for PERT."
Definition
PERT is a probabilistic project scheduling technique that accounts for uncertainty in activity duration using three time estimates.
Three Time Estimates
| Estimate | Symbol | Description |
|---|---|---|
| Optimistic | \(t_o\) | Best case (minimum time) |
| Most Likely | \(t_m\) | Normal conditions |
| Pessimistic | \(t_p\) | Worst case (maximum time) |
PERT Formulas
Expected Time:
Variance:
Standard Deviation:
Project Variance (for critical path):
CPM vs. PERT
| Feature | CPM | PERT |
|---|---|---|
| Nature | Deterministic | Probabilistic |
| Time Estimate | Single (fixed) duration | Three estimates (\(t_o, t_m, t_p\)) |
| Application | Construction, routine projects | R&D, new/uncertain projects |
| Focus | Cost-time trade-off | Time-uncertainty analysis |
| Activity Duration | Known with certainty | Uncertain, uses Beta distribution |
Solved Example — PERT
Q. Given the following data for a project, calculate expected time for each activity and find the critical path.
| Activity | \(t_o\) | \(t_m\) | \(t_p\) | Predecessors |
|---|---|---|---|---|
| A | 2 | 4 | 6 | — |
| B | 1 | 3 | 11 | — |
| C | 3 | 5 | 7 | A |
| D | 2 | 6 | 10 | B |
| E | 4 | 5 | 12 | A, B |
Solution:
Step 1 — Calculate Expected Time (\(t_e\)):
| Activity | \(t_e = \frac{t_o + 4t_m + t_p}{6}\) | \(t_e\) |
|---|---|---|
| A | \((2 + 16 + 6)/6\) | 4 |
| B | \((1 + 12 + 11)/6\) | 4 |
| C | \((3 + 20 + 7)/6\) | 5 |
| D | \((2 + 24 + 10)/6\) | 6 |
| E | \((4 + 20 + 12)/6\) | 6 |
Step 2 — Forward Pass and Critical Path:
- Path A → C: 4 + 5 = 9
- Path A → E: 4 + 6 = 10
- Path B → D: 4 + 6 = 10
- Path B → E: 4 + 6 = 10
Step 3 — Variance of Critical Path (using B → D):
5. Gantt Chart
Likely Exam Question (5 marks)
"What is a Gantt Chart? Explain its advantages and limitations."
Definition
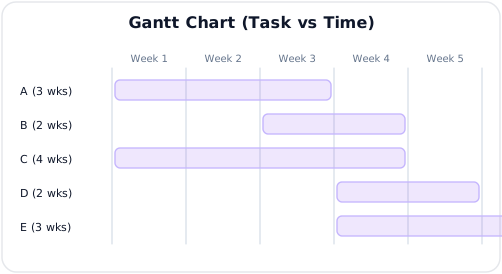
A Gantt Chart is a horizontal bar chart that shows project tasks against time, indicating start dates, end dates, and progress.
Example
Advantages and Limitations
| Advantages | Limitations |
|---|---|
| Easy to understand and create | Does not show task dependencies clearly |
| Shows timeline visually | Becomes complex for large projects |
| Tracks progress easily | Does not identify critical path |
| Good for communication | Difficult to show resource allocation |
| Shows overlapping activities | Not suitable for dynamic changes |
Gantt Chart vs. Network Diagrams
| Feature | Gantt Chart | Network Diagram (CPM/PERT) |
|---|---|---|
| Visual style | Bar chart | Node-and-arrow graph |
| Dependencies | Not explicit | Clearly shown |
| Critical path | Not visible | Identified |
| Best for | Simple tracking | Complex analysis |
6. Project Scheduling and Resource Leveling
Likely Exam Question (5 marks)
"What is resource leveling? Why is it important in project management?"
6.1 Project Scheduling
Project scheduling involves:
- Identifying all activities and their durations
- Establishing dependencies between activities
- Allocating resources to each activity
- Creating a timeline using CPM/PERT or Gantt charts
6.2 Resource Leveling
Resource Leveling is the technique of adjusting the project schedule to resolve resource over-allocation without changing the project scope.
Why Resource Leveling?
- Resources (people, equipment) are limited
- Multiple activities may need the same resource simultaneously
- Prevents burnout and equipment overuse
Methods
| Method | Description | Impact |
|---|---|---|
| Delay Non-Critical Activities | Shift activities with float to periods of less demand | May not extend project |
| Activity Splitting | Break an activity into parts | Increases complexity |
| Resource Smoothing | Adjust within available float only | Project duration unchanged |
| Resource Leveling | May extend project duration to resolve over-allocation | Project duration may increase |
Example
If Activity B and Activity C both need the same crane in Week 3:
- Check float of B and C
- Delay the one with higher float to Week 4
- If both are critical → need additional resource or accept delay
6.3 Cost Control in Projects
Earned Value Management (EVM) is the standard method for cost and schedule performance measurement.
| Metric | Formula | Meaning |
|---|---|---|
| Planned Value (PV) | Budgeted cost of scheduled work | What should have been spent |
| Earned Value (EV) | Budgeted cost of work performed | Value of work completed |
| Actual Cost (AC) | Actual cost of work performed | What was actually spent |
| Cost Variance (CV) | \(CV = EV - AC\) | Negative = over budget |
| Schedule Variance (SV) | \(SV = EV - PV\) | Negative = behind schedule |
| Cost Performance Index (CPI) | \(CPI = EV / AC\) | < 1.0 = over budget |
| Schedule Performance Index (SPI) | \(SPI = EV / PV\) | < 1.0 = behind schedule |
Solved Example — EVM
Q. A project has PV = Rs. 50,000, EV = Rs. 45,000, and AC = Rs. 55,000. Calculate CV, SV, CPI, and SPI. Interpret the results.
Solution:
Key Exam Points — Scheduling & Cost Control
- Resource leveling may increase project duration
- EVM integrates scope, schedule, and cost measurement
- CPI < 1 = over budget; SPI < 1 = behind schedule
7. Operational Budget
Likely Exam Question (5 marks)
"What is an operational budget? Explain its components."
Definition
An operational budget is a financial plan for the day-to-day operations of an organization for a specific period (usually one year).
Components
| Component | Description | Example |
|---|---|---|
| Revenue Budget | Expected income | Service charges, subscription fees |
| Personnel Budget | Salaries, benefits, training | Staff wages, allowances |
| Operating Expense Budget | Day-to-day costs | Rent, utilities, maintenance |
| Capital Budget | Long-term investments | Equipment, infrastructure |
| Contingency Reserve | Buffer for unexpected costs | 5–10% of total budget |
Budget Preparation Process
- Review Previous Year — Analyze actual vs. budgeted
- Set Objectives — Align with strategic goals
- Estimate Revenue — Project income streams
- Estimate Expenses — Detail all cost categories
- Review & Approve — Management approval
- Monitor & Control — Periodic variance analysis
Quality–Time–Cost Dimensions
| Dimension | Objective | Measure |
|---|---|---|
| Quality | Meet specifications | Defect rate, customer satisfaction |
| Time | Complete on schedule | Milestones met, SPI |
| Cost | Stay within budget | Variance, CPI |
8. Negotiating
Likely Exam Question (5 marks)
"What are the key negotiation strategies in project management?"
Definition
Negotiation is a process in which two or more parties with different interests reach an agreement through discussion and compromise.
Negotiation Strategies
| Strategy | Description | When to Use |
|---|---|---|
| Win-Win (Collaborative) | Both parties gain value | Long-term relationships |
| Win-Lose (Competitive) | One party gains at other's expense | One-time deals, adversarial |
| Compromise | Both parties give up something | Time pressure, equal power |
| Accommodate | Yield to other party | Preserve relationship |
| Avoid | Withdraw from negotiation | Low-priority issues |
BATNA (Best Alternative to a Negotiated Agreement)
- Know your BATNA before negotiating
- Stronger BATNA = stronger negotiation position
- Never accept a deal worse than your BATNA
Key Negotiation Skills for Project Managers
- Active listening
- Clear communication
- Understanding stakeholder interests
- Flexibility and creativity
- Emotional intelligence
9. Monitoring and Evaluation (M&E)
Likely Exam Question (5 marks)
"Differentiate between monitoring and evaluation in project management."
Monitoring vs. Evaluation
| Aspect | Monitoring | Evaluation |
|---|---|---|
| Timing | Continuous, during implementation | Periodic (mid-term, end-term) |
| Purpose | Track progress, detect problems early | Assess overall impact and effectiveness |
| Focus | Activities, inputs, outputs | Outcomes, impact |
| Who | Project team, managers | External evaluators, stakeholders |
| Nature | Operational | Strategic and analytical |
Key Performance Indicators (KPIs)
| KPI Category | Example |
|---|---|
| Schedule | % milestones completed on time |
| Cost | Budget variance, CPI |
| Quality | Defect rate, rework percentage |
| Scope | Number of change requests |
| Stakeholder | Customer satisfaction score |
Monitoring Tools
- Dashboard Reports — Visual summary of project status
- Earned Value Analysis — Integrated cost-schedule tracking
- Status Meetings — Regular team check-ins
- Milestone Reviews — Assessment at key project points
- Variance Analysis — Compare planned vs. actual
10. Quality Management
Likely Exam Question (10 marks)
"What is Total Quality Management (TQM)? Explain Deming's 14 Points."
10.1 Quality Concepts
Quality is the degree to which a product or service meets customer requirements and expectations.
| Quality Guru | Contribution |
|---|---|
| W. Edwards Deming | 14 Points, PDCA Cycle, System of Profound Knowledge |
| Joseph Juran | Quality Trilogy (Planning, Control, Improvement) |
| Philip Crosby | Zero Defects, Quality is Free |
| Kaoru Ishikawa | Fishbone/Cause-Effect Diagram, Quality Circles |
| Genichi Taguchi | Loss Function, Robust Design |
10.2 Total Quality Management (TQM)
TQM is a management approach focused on continuous improvement of quality in all organizational processes, led by top management and involving all employees.
Principles of TQM
| Principle | Description |
|---|---|
| Customer Focus | Quality defined by customer needs |
| Total Employee Involvement | All employees contribute to quality |
| Process Approach | Focus on processes, not just outputs |
| Continuous Improvement (Kaizen) | Small, incremental improvements |
| Fact-Based Decision Making | Use data and statistical tools |
| System Integration | All subsystems aligned toward quality |
| Leadership Commitment | Top management drives quality culture |
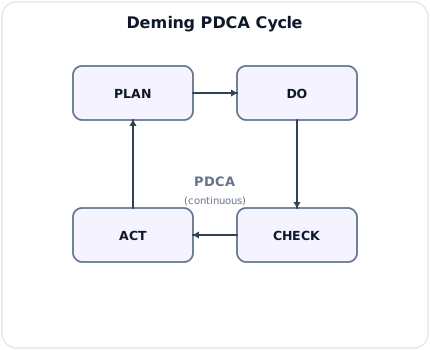
10.3 Deming's PDCA Cycle (Deming Wheel)
10.4 Deming's 14 Points for Management
| # | Point |
|---|---|
| 1 | Create constancy of purpose for improvement |
| 2 | Adopt the new philosophy |
| 3 | Cease dependence on mass inspection — build quality in |
| 4 | End the practice of awarding business based on price alone |
| 5 | Improve constantly every process |
| 6 | Institute training on the job |
| 7 | Adopt and institute leadership |
| 8 | Drive out fear |
| 9 | Break down barriers between departments |
| 10 | Eliminate slogans and exhortations |
| 11 | Eliminate numerical quotas |
| 12 | Remove barriers to pride of workmanship |
| 13 | Encourage education and self-improvement |
| 14 | Take action to accomplish the transformation |
10.5 Quality Management Tools
Seven Basic Quality Tools
| Tool | Purpose |
|---|---|
| Cause-Effect Diagram (Ishikawa/Fishbone) | Identify root causes of problems |
| Check Sheet | Collect and organize data |
| Control Chart | Monitor process stability over time |
| Histogram | Show frequency distribution |
| Pareto Chart | Identify vital few vs. trivial many (80/20 rule) |
| Scatter Diagram | Show relationship between two variables |
| Flowchart | Map a process step-by-step |
10.6 Six Sigma
Six Sigma is a data-driven methodology for eliminating defects (achieving 3.4 defects per million opportunities).
DMAIC Process
| Phase | Activity |
|---|---|
| Define | Define the problem, project scope |
| Measure | Measure current process performance |
| Analyze | Identify root causes of defects |
| Improve | Develop and implement solutions |
| Control | Sustain improvements with monitoring |
10.7 ISO 9001 Quality Management System
ISO 9001 is the international standard for Quality Management Systems (QMS).
| Principle | Description |
|---|---|
| Customer Focus | Meet and exceed customer expectations |
| Leadership | Create unity of purpose |
| Engagement of People | Competent, empowered people |
| Process Approach | Manage activities as processes |
| Improvement | Ongoing improvement as objective |
| Evidence-Based Decisions | Based on data analysis |
| Relationship Management | Manage relationships with stakeholders |
Key Exam Points — Quality Management
- TQM focuses on continuous improvement with customer focus
- PDCA: Plan → Do → Check → Act (repeated continuously)
- Know Deming's 14 Points (at least 5)
- Pareto Principle: 80% of problems come from 20% of causes
- Six Sigma DMAIC: Define → Measure → Analyze → Improve → Control
- ISO 9001: International quality management standard with 7 principles