Loss, Dispersion, Sources and Detectors - TikZ Figures
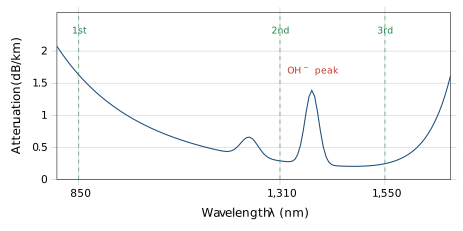
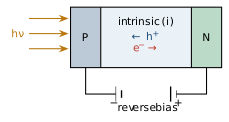
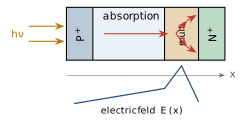
Fig: Silica attenuation spectrum: Rayleigh scattering falls as ^-4, the OH^- peak sits near 1383, and infrared absorption rises beyond 1600. The three low-loss windows are 850, 1310 and 1550 (0.2)Fig: Dispersion broadens a narrow input pulse; when broadening approaches the bit period, ISI resultsFig: PIN photodiode: light absorbed in the wide intrinsic region; the reverse field sweeps carriers to the terminals (M=1)Fig: APD: primary pairs generated in the absorption region are multiplied by impact ionization in the high-field region (M>1)Fig: Complete optical link: line coder driver source fibre detector transimpedance amplifier filter/decision output