Chapter 3 — Financial Management and Procurement
1. Business and Accounting Terminology
Likely Exam Question (5 marks)
"Define the following business/accounting terms: assets, liabilities, equity, revenue, depreciation."
Key Business Terms
| Term | Definition |
|---|---|
| Assets | Resources owned by a business (cash, property, equipment) |
| Liabilities | Obligations/debts owed to others (loans, accounts payable) |
| Equity | Owner's claim on assets after deducting liabilities (\(\text{Equity} = \text{Assets} - \text{Liabilities}\)) |
| Revenue | Income earned from normal business operations |
| Expense | Costs incurred in earning revenue |
| Profit (Net Income) | Revenue minus total expenses |
| Capital | Money invested in the business by owners |
| Dividend | Distribution of profits to shareholders |
| Working Capital | Current Assets − Current Liabilities (day-to-day liquidity) |
Key Accounting Terms
| Term | Definition |
|---|---|
| Debit (Dr) | Left side of an account; increases assets/expenses |
| Credit (Cr) | Right side of an account; increases liabilities/income/equity |
| Ledger | Book containing all accounts |
| Journal | Chronological record of all transactions |
| Fiscal Year | 12-month accounting period (Nepal: Shrawan to Ashad) |
| Accrual Basis | Record transactions when they occur (not when cash is exchanged) |
| Cash Basis | Record transactions only when cash changes hands |
Fundamental Accounting Equation
Key Exam Points — Terminology
- Accounting equation must always balance
- Working Capital = Current Assets − Current Liabilities
- Nepal fiscal year: Shrawan 1 to Ashad end (mid-July to mid-July)
2. Cost Classification and Analysis
Likely Exam Question (5 marks)
"Classify costs based on behavior and function. Explain fixed, variable, and semi-variable costs."
2.1 Classification by Behavior
| Type | Description | Example |
|---|---|---|
| Fixed Cost | Does not change with output volume | Rent, salary, insurance |
| Variable Cost | Changes directly with output | Raw materials, commission |
| Semi-Variable (Mixed) | Has both fixed and variable components | Electricity (base charge + usage), telephone bills |
Total Cost Formula
Where: \(FC\) = Fixed Cost, \(v\) = Variable cost per unit, \(Q\) = Quantity
2.2 Classification by Function
| Type | Description | Example |
|---|---|---|
| Production/Manufacturing | Direct costs of making product | Raw material, factory labor |
| Administrative | Office and management costs | Office rent, management salaries |
| Selling & Distribution | Marketing and delivery costs | Advertising, transport |
| Finance | Cost of borrowing | Interest on loans |
2.3 Direct vs. Indirect Costs
| Direct Costs | Indirect Costs (Overhead) |
|---|---|
| Traceable to specific product/project | Cannot be traced to specific product |
| Raw materials, direct labor | Rent, utilities, supervision |
| Vary with output | Allocated using cost drivers |
2.4 Break-Even Analysis
Break-Even Point (BEP) is where total revenue equals total cost (no profit, no loss).
Where: \(P\) = Selling price per unit, \(v\) = Variable cost per unit
Solved Example — Break-Even
Q. Fixed cost = Rs. 200,000. Selling price = Rs. 50/unit. Variable cost = Rs. 30/unit. Find BEP.
Key Exam Points — Cost Analysis
- BEP: Total Revenue = Total Cost → Zero profit
- Contribution Margin = Selling Price − Variable Cost per unit
- Higher fixed costs → higher BEP
3. Interest and Time Value of Money
Likely Exam Question (10 marks)
"Explain the concept of time value of money. Calculate present value and future value."
Time Value of Money (TVM)
Core Principle: A rupee today is worth more than a rupee tomorrow because of its earning potential (interest).
Simple Interest
Where: \(P\) = Principal, \(r\) = annual interest rate, \(t\) = time in years, \(A\) = Amount
Compound Interest
For annual compounding (\(n = 1\)):
Future Value (FV) and Present Value (PV)
Where: \(n\) = number of periods, \(r\) = discount rate per period
Key TVM Factors
| Factor | Formula | Notation |
|---|---|---|
| Future Value Factor | \((1 + r)^n\) | \((F/P, r, n)\) |
| Present Value Factor | \(\frac{1}{(1 + r)^n}\) | \((P/F, r, n)\) |
| Uniform Series (Annuity) FV | \(\frac{(1+r)^n - 1}{r}\) | \((F/A, r, n)\) |
| Uniform Series (Annuity) PV | \(\frac{(1+r)^n - 1}{r(1+r)^n}\) | \((P/A, r, n)\) |
| Capital Recovery | \(\frac{r(1+r)^n}{(1+r)^n - 1}\) | \((A/P, r, n)\) |
| Sinking Fund | \(\frac{r}{(1+r)^n - 1}\) | \((A/F, r, n)\) |
Solved Example — PV and FV
Q. If Rs. 100,000 is invested at 10% annual compound interest, find the value after 5 years. Also find the present value of Rs. 200,000 to be received 5 years from now at 10%.
Annuity
An annuity is a series of equal payments at regular intervals.
Q. Find the PV of an annuity of Rs. 10,000 per year for 5 years at 8%.
Key Exam Points — TVM
- Money has time value due to earning potential
- \(FV = PV(1+r)^n\) and \(PV = FV/(1+r)^n\)
- Know all 6 TVM factors and when to use each
- Annuity = equal periodic payments
4. Engineering Economics
Likely Exam Question (10 marks)
"Explain NPV and IRR methods of investment appraisal with numerical examples."
4.1 Net Present Value (NPV)
Where: \(CF_t\) = Cash flow at time \(t\), \(r\) = discount rate, \(C_0\) = initial investment
Decision Rule:
- NPV > 0 → Accept (project adds value)
- NPV < 0 → Reject
- NPV = 0 → Indifferent
4.2 Internal Rate of Return (IRR)
IRR is the discount rate at which NPV = 0.
Decision Rule:
- IRR > Required Rate of Return → Accept
- IRR < Required Rate of Return → Reject
4.3 EIRR and FIRR
| Type | Full Form | Perspective | Includes |
|---|---|---|---|
| FIRR | Financial Internal Rate of Return | Investor/project owner | Only financial cash flows (revenue, costs) |
| EIRR | Economic Internal Rate of Return | Society/economy | Includes externalities (social benefits, environmental costs) |
- FIRR uses market prices
- EIRR uses shadow/economic prices (adjusted for taxes, subsidies, externalities)
- For public projects (telecom, roads), EIRR is more relevant
4.4 Benefit-Cost Ratio (BCR)
- BCR > 1 → Accept
- BCR < 1 → Reject
4.5 Payback Period
(For unequal cash flows: cumulative method)
Solved Example — NPV and IRR
Q. Project costs Rs. 500,000. Expected cash flows: Year 1 = 150,000; Year 2 = 200,000; Year 3 = 250,000; Year 4 = 200,000. Discount rate = 12%. Calculate NPV and determine acceptability.
| Year | Cash Flow | PV Factor @12% | Present Value |
|---|---|---|---|
| 0 | −500,000 | 1.000 | −500,000 |
| 1 | 150,000 | 0.893 | 133,950 |
| 2 | 200,000 | 0.797 | 159,400 |
| 3 | 250,000 | 0.712 | 178,000 |
| 4 | 200,000 | 0.636 | 127,200 |
| NPV | 98,550 |
Comparison of Investment Appraisal Methods
| Method | Advantage | Disadvantage |
|---|---|---|
| NPV | Considers TVM, absolute value of wealth | Requires predetermining discount rate |
| IRR | Easy to understand (%), no need for discount rate | Multiple IRRs possible, assumes reinvestment at IRR |
| Payback | Simple, quick assessment | Ignores TVM and cash flows after payback |
| BCR | Good for public projects | May conflict with NPV for mutually exclusive projects |
4.6 Risk Analysis in Investment
| Method | Description |
|---|---|
| Sensitivity Analysis | Change one variable at a time, observe effect on NPV |
| Scenario Analysis | Best case, worst case, most likely case |
| Monte Carlo Simulation | Computer-generated random sampling of variables |
| Decision Tree | Visual map of decisions and possible outcomes |
| Risk-Adjusted Discount Rate | Higher discount rate for riskier projects |
Key Exam Points — Engineering Economics
- NPV > 0 → Accept; IRR > hurdle rate → Accept
- FIRR = financial perspective; EIRR = economic/social perspective
- BCR > 1 → Accept
- Sensitivity analysis: one variable at a time
5. Trial Balance, Balance Sheet, and Income Statement
Likely Exam Question (10 marks)
"Prepare a Trial Balance and Balance Sheet from the given data."
5.1 Trial Balance
A Trial Balance is a statement listing all ledger account balances to verify that total debits equal total credits.
| Account | Debit (Rs.) | Credit (Rs.) |
|---|---|---|
| Cash | 50,000 | |
| Accounts Receivable | 30,000 | |
| Equipment | 200,000 | |
| Accounts Payable | 40,000 | |
| Bank Loan | 100,000 | |
| Capital | 120,000 | |
| Revenue | 80,000 | |
| Salaries Expense | 40,000 | |
| Rent Expense | 20,000 | |
| Total | 340,000 | 340,000 |
- If totals don't match → errors exist (but matching doesn't guarantee error-free)
- Errors not revealed: Errors of omission, commission, principle, compensating, original entry
5.2 Income Statement (Profit & Loss Account)
Shows revenue and expenses over a period.
Revenue (Sales)                         Rs. 500,000
Less: Cost of Goods Sold               (Rs. 300,000)
─────────────────────────────────────────────────────
Gross Profit                            Rs. 200,000
Less: Operating Expenses
  - Salaries                (80,000)
  - Rent                    (24,000)
  - Depreciation            (20,000)
  - Utilities               (16,000)   (Rs. 140,000)
─────────────────────────────────────────────────────
Operating Profit (EBIT)                 Rs. 60,000
Less: Interest Expense                  (Rs. 10,000)
─────────────────────────────────────────────────────
Profit Before Tax                       Rs. 50,000
Less: Tax (25%)                         (Rs. 12,500)
─────────────────────────────────────────────────────
Net Profit                              Rs. 37,500
5.3 Balance Sheet
Shows financial position at a specific date.
| Assets | Rs. | Liabilities & Equity | Rs. |
|---|---|---|---|
| Current Assets | Current Liabilities | ||
| Cash | 50,000 | Accounts Payable | 40,000 |
| Accounts Receivable | 30,000 | Short-term Loan | 20,000 |
| Inventory | 40,000 | Total Current Liabilities | 60,000 |
| Total Current | 120,000 | ||
| Non-Current Assets | Non-Current Liabilities | ||
| Equipment | 200,000 | Bank Loan | 100,000 |
| Less: Depreciation | (40,000) | ||
| Net Equipment | 160,000 | Owner's Equity | |
| Capital | 120,000 | ||
| Retained Earnings | - | ||
| Total Assets | 280,000 | Total L + E | 280,000 |
Key Exam Points — Financial Statements
- Trial Balance: Debit total must equal Credit total
- Income Statement: Revenue − Expenses = Net Profit
- Balance Sheet: Assets = Liabilities + Equity (must balance)
- Balance Sheet is a snapshot; Income Statement covers a period
6. Depreciation
Likely Exam Question (10 marks)
"Explain different methods of depreciation with examples."
Definition
Depreciation is the systematic allocation of the cost of a tangible asset over its useful life.
Key Terms
| Term | Definition |
|---|---|
| Original Cost (C) | Purchase price + installation + transport |
| Salvage Value (S) | Estimated value at end of useful life |
| Useful Life (n) | Expected period of productive use |
| Book Value | Original cost minus accumulated depreciation |
6.1 Straight Line Method (SLM)
Example: Machine cost = Rs. 500,000, Salvage = Rs. 50,000, Life = 10 years.
6.2 Declining Balance Method (DBM)
Where: \(r\) = depreciation rate, \(BV\) = Book Value at beginning of year
Example: \(C\) = Rs. 100,000, \(S\) = Rs. 10,000, \(n\) = 5 years.
| Year | Beginning BV | Depreciation | Ending BV |
|---|---|---|---|
| 1 | 100,000 | 36,900 | 63,100 |
| 2 | 63,100 | 23,284 | 39,816 |
| 3 | 39,816 | 14,692 | 25,124 |
| 4 | 25,124 | 9,271 | 15,853 |
| 5 | 15,853 | 5,850 | 10,003 ≈ 10,000 |
6.3 Sum-of-Years'-Digits Method (SOYD)
Example: \(C\) = Rs. 100,000, \(S\) = Rs. 10,000, \(n\) = 5 years.
| Year | Fraction | Depreciation |
|---|---|---|
| 1 | 5/15 | 30,000 |
| 2 | 4/15 | 24,000 |
| 3 | 3/15 | 18,000 |
| 4 | 2/15 | 12,000 |
| 5 | 1/15 | 6,000 |
| Total | 90,000 |
Comparison of Depreciation Methods
| Method | Pattern | Tax Benefit |
|---|---|---|
| Straight Line | Equal annual amounts | Spread evenly |
| Declining Balance | Decreasing amounts | Higher in early years |
| SOYD | Decreasing amounts | Higher in early years |
Key Exam Points — Depreciation
- SLM: \(D = (C - S)/n\) — simplest and most common
- Accelerated methods (DBM, SOYD) give more depreciation early = tax advantage
- Book Value = Cost − Accumulated Depreciation
- Nepal: Generally SLM used for government accounting
7. Procurement Procedures
Likely Exam Question (10 marks)
"Explain the following procurement terms: FOB, CIF, Liquidated Damages, Letter of Credit, Performance Bond."
7.1 Procurement Overview
Procurement is the process of acquiring goods, works, and services from external sources through a systematic, transparent, and competitive process.
7.2 Key Procurement/Trade Terms (Incoterms)
| Term | Full Form | Description |
|---|---|---|
| FOB | Free on Board | Seller's responsibility ends when goods are loaded on ship at port of origin. Buyer bears freight and insurance. |
| CIF | Cost, Insurance, and Freight | Seller pays cost + insurance + freight to destination port. Risk transfers when goods cross ship's rail at origin. |
| FCA | Free Carrier | Seller delivers goods to carrier at named place |
| EXW | Ex Works | Buyer bears all costs from seller's premises |
| DDP | Delivered Duty Paid | Seller delivers goods to destination, all duties paid |
| CFR | Cost and Freight | Seller pays cost + freight (no insurance) |
FOB vs. CIF Comparison
| Aspect | FOB | CIF |
|---|---|---|
| Cost borne by seller | Up to loading on ship | Cost + Insurance + Freight |
| Risk transfers at | Ship's rail at origin | Ship's rail at origin |
| Insurance | Buyer's responsibility | Seller's responsibility |
| Commonly used | Bulk commodities | General merchandise |
7.3 Financial Instruments in Procurement
| Instrument | Description | Purpose |
|---|---|---|
| Letter of Credit (LC) | Bank guarantee that seller will receive payment if terms met | Ensures payment security for seller |
| Bank Guarantee | Bank's promise to pay if the party fails to fulfill obligations | Protects buyer against non-performance |
| Performance Bond | Guarantee that contractor will complete work as per contract (typically 5–10% of contract value) | Protects against poor performance |
| Bid Bond/Earnest Money | Deposit submitted with tender (typically 2–3% of bid value) | Ensures serious bidders only |
| Advance Payment Guarantee | Guarantee against advance payment made to supplier | Protects buyer's advance payment |
| Retention Money | Portion withheld from payments (typically 5–10%) until defect liability period ends | Ensures quality/defect-free delivery |
7.4 Liquidated Damages (LD)
Liquidated Damages are pre-determined amounts agreed in the contract, payable by the contractor for each day/week of delay.
- Typically 0.5% to 1% per week of delay
- Maximum usually 10% of contract value
- Must be a genuine pre-estimate of loss (not a penalty)
- Applied automatically without proving actual loss
Example: Contract value = Rs. 10,000,000. LD rate = 0.5% per week. Max LD = 10%.
7.5 Types of Contracts
| Type | Description | Risk |
|---|---|---|
| Lump Sum (Fixed Price) | Fixed total price for defined scope | Contractor bears cost risk |
| Unit Rate | Payment per unit of work done | Shared risk |
| Cost Plus | Actual cost + fixed fee/percentage | Client bears cost risk |
| Time & Material | Payment based on time spent + materials | Client bears most risk |
| Turnkey | Contractor does everything (design + build + commission) | Contractor bears full risk |
8. Competitive Bidding
Likely Exam Question (10 marks)
"Explain the competitive bidding process. What are the different methods of procurement?"
8.1 Procurement Methods
| Method | Description | When Used |
|---|---|---|
| Open Competitive Bidding (ICB/NCB) | Public invitation to all eligible bidders | Large value contracts, transparency required |
| Limited/Restricted Bidding | Invitation to pre-qualified or shortlisted firms | Specialized work, limited suppliers |
| Direct Procurement | Single source purchasing | Emergency, sole supplier, proprietary items |
| Request for Quotation (RFQ) | Seek price quotes from multiple suppliers | Low-value, standard items |
| Request for Proposal (RFP) | Seek technical and financial proposals | Consultancy, complex services |
8.2 Competitive Bidding Process
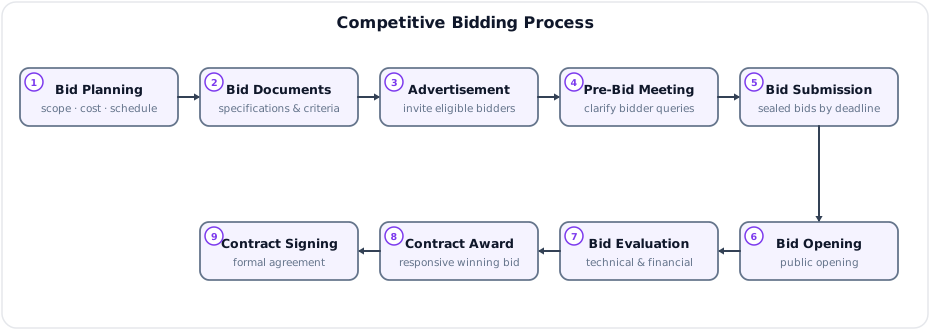
- Bid Planning — Define scope, estimate cost, set timeline
- Preparation of Bid Documents — Technical specs, terms, evaluation criteria
- Invitation/Advertisement — Newspaper, website (minimum 30 days for ICB)
- Pre-Bid Meeting — Clarify bidder queries
- Bid Submission — Sealed bids by deadline
- Bid Opening — Public opening, read prices aloud
- Bid Evaluation — Technical and financial evaluation
- Contract Award — Lowest evaluated responsive bid
- Contract Signing — Formal agreement execution
8.3 Bid Evaluation Criteria
| Criterion | Description |
|---|---|
| Responsiveness | Meets all mandatory requirements of bid document |
| Technical Compliance | Meets technical specifications |
| Financial Evaluation | Lowest evaluated price (after corrections, adjustments) |
| Qualification | Bidder has capacity, experience, financial strength |
8.4 Two-Envelope vs. Single-Envelope System
| Aspect | Single Envelope | Two Envelope |
|---|---|---|
| Contents | Technical + Financial in one envelope | Separate technical and financial envelopes |
| Opening | All opened together | Technical opened first; financial opened only for qualified bidders |
| Best for | Simple procurement, goods | Complex services, consultancy, quality-focused procurement |
8.5 Nepal's Public Procurement Act, 2063 (2007)
Key provisions:
- Public Procurement Monitoring Office (PPMO) oversees procurement
- Mandatory e-bidding for contracts above threshold
- Lowest evaluated bid criterion for goods and works
- Quality and Cost Based Selection (QCBS) for consultancy
- Complaint mechanism and review process
- Anti-corruption provisions and code of ethics
Procurement Methods for Consultancy (Nepal)
| Method | Abbreviation | Weightage |
|---|---|---|
| Quality & Cost Based Selection | QCBS | Technical: 70–80%, Financial: 20–30% |
| Quality Based Selection | QBS | 100% technical merit |
| Least Cost Selection | LCS | Minimum quality met → lowest price |
| Fixed Budget Selection | FBS | Best quality within fixed budget |
| Individual Consultant Selection | ICS | For individual experts |
Key Exam Points — Procurement
- FOB: Seller loads on ship; CIF: Seller pays cost + insurance + freight
- Liquidated Damages: Pre-agreed penalty for delay (not actual loss proof needed)
- Letter of Credit: Bank guarantee ensuring seller gets paid
- Performance Bond: Typically 5–10% of contract value
- Competitive bidding: Open, transparent, lowest evaluated responsive bid
- Nepal: PPMO monitors public procurement under Public Procurement Act 2063
- Consultancy: QCBS (70-80% technical weight) is most common method